 @model ReportView
 <script>
 </script>
 <div class="container" style="background-color:#ffffff">
   <section>
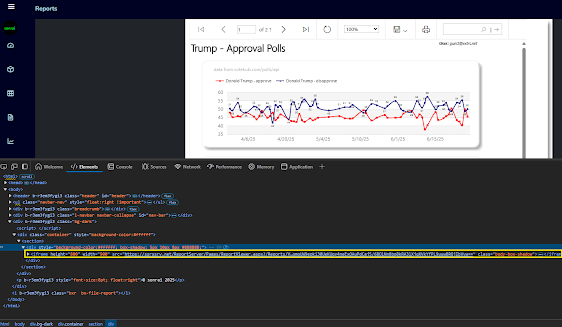
     <div style="background-color:#ffffff; box-shadow: 5px 10px 8px #888888;">
       <iframe height="800" width="900" src="@Model.SelectedReport.Uri" class="body-box-shadow"></iframe>
     </div>
   </section>
 </div>
 <script src="https://code.highcharts.com/highcharts.js"></script>
 <script src="https://code.highcharts.com/themes/adaptive.js"></script>
 <head>
   <script>
     $(document).ready(function () {
       Highcharts.seriesTypes.line.prototype.getPointSpline = Highcharts.seriesTypes.spline.prototype.getPointSpline;
       Highcharts.chart('potusApproval', {
       title: {
         text: 'Trump Job Approval',
         align: 'left'
       },
       subtitle: {
           text: 'Source: <a href="https://api.votehub.com/polls?poll_type=approval&subject=Trump" target="_blank">VoteHub</a>.',
         align: 'left'
       },
       yAxis: {
         title: {
           text: 'Approval'
         }
       },
       legend: {
         layout: 'vertical',
         align: 'right',
         verticalAlign: 'middle'
       },
       plotOptions: {
             area: {
               pointStart: '1/1/2025',
               relativeXValue: false,
               marker: {
                 enabled: true,
                 symbol: 'circle',
                 radius: 2,
                 states: {
                   hover: {
                     enabled: true
                   }
                 }
               }
             }
           },
       series: [{
         name: 'Approve',
         data: [ @string.Join(", ", Model.HighChartsModel.Approves) ]
       }, {
         name: 'Disapprove',
         data: [ @string.Join(", ", Model.HighChartsModel.Disapproves) ]
       }],
     });
   });
   </script>
 </head>
 <table style="width: 100%; height:50%">
   <tr><td><div id="potusApproval"></div></td></tr>
 </table>
<iframe title="PBI_Report" style="width:100%; height:73%" src="https://app.powerbi.com/reportEmbed?reportId=695fe0f1-5c9e-497d-8913-e59f0b939ac4&autoAuth=true&embeddedDemo=true" frameborder="0" allowFullScreen="true"></iframe>
Reference: https://learn.microsoft.com/en-us/power-bi/developer/
Source: https://github.com/sonrai-LLC/extRS/tree/main/ExtRS.Portal | https://extrs.net


