I came across ChartJS about 2 years ago while debugging code from another, similar data visualization technology inside an AngularJS app.

The concept is you have a "<canvas>" DOM element, which you transform into a ChartJS chart via some JavaScript initialization. After that your tasks are simply finding the data you want to render and deciding the options of exactly how you want the chart visual to appear.
You can do some really neat and dynamic stuff with ChartJS.
I have used a lot of charting frameworks, and it does not get more flexible or simple than this:
Reference: https://www.chartjs.org/
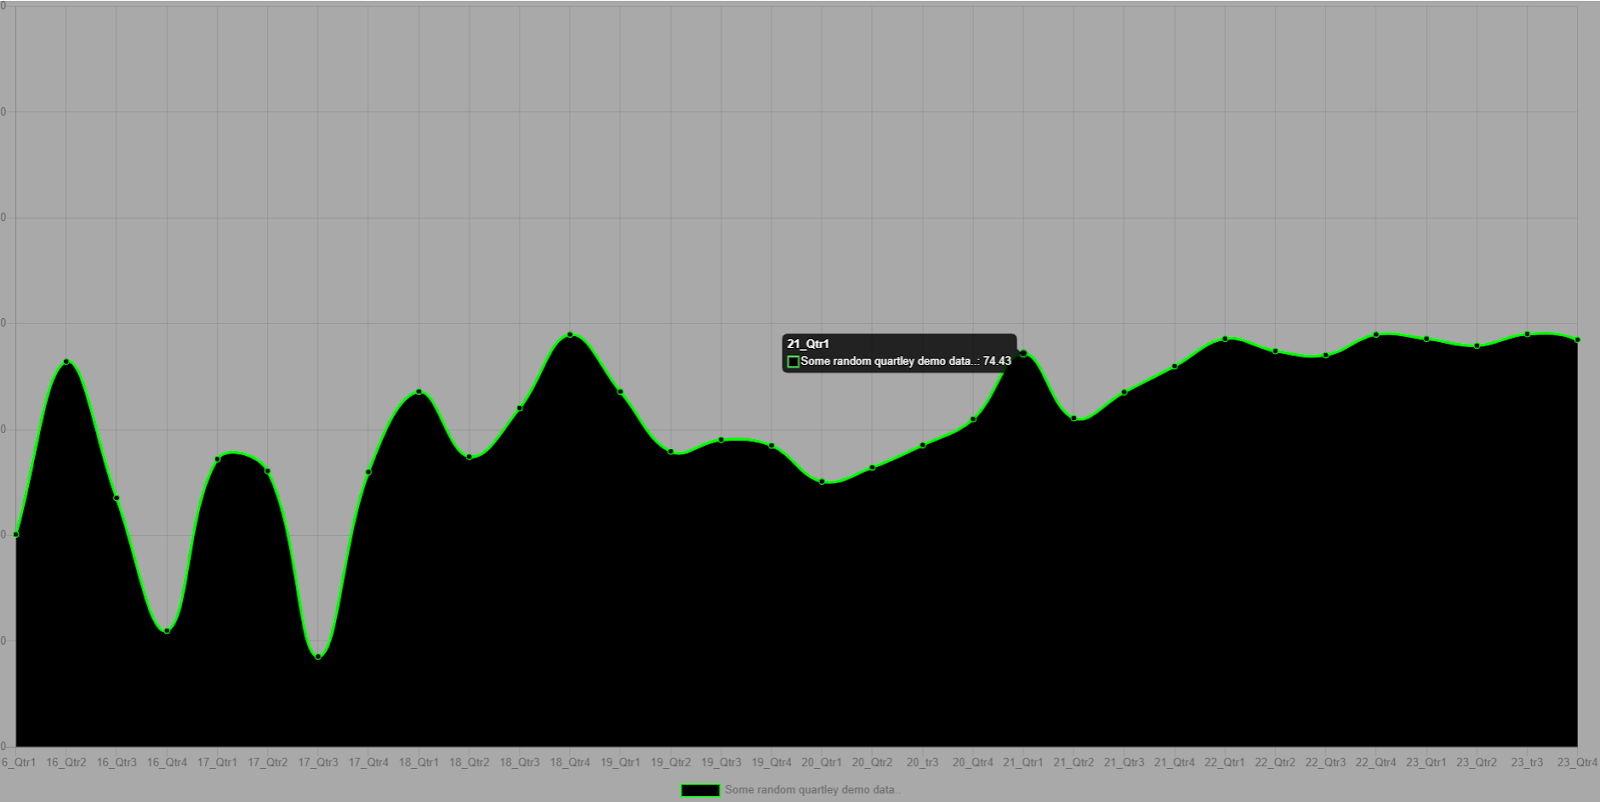
ChartJS is a flexible JavaScript data visualization framework which allows for some pretty powerful integrations and customizations
You can do some really neat and dynamic stuff with ChartJS.
I have used a lot of charting frameworks, and it does not get more flexible or simple than this:
 <html>
 <head>
 <script src="https://cdn.jsdelivr.net/npm/chart.js@2.8.0"></script>
 </head>
 <body>
 <div>
 <canvas id="myChart" style='background-color:darkgray; width:100%; height:100%;'></canvas>
 </div>
 <script>
 var ctx = document.getElementById('myChart').getContext('2d');;
 var chart = new Chart(ctx, {
   type: 'line',
   data: {
     labels: ['16_Qtr1', '16_Qtr2', '16_Qtr3', '16_Qtr4', '17_Qtr1', '17_Qtr2', '17_Qtr3', '17_Qtr4', '18_Qtr1', '18_Qtr2', '18_Qtr3', '18_Qtr4', '19_Qtr1', '19_Qtr2', '19_Qtr3', '19_Qtr4', '20_Qtr1', '20_Qtr2', '20_tr3', '20_Qtr4', '21_Qtr1', '21_Qtr2', '21_Qtr3', '21_Qtr4','22_Qtr1', '22_Qtr2', '22_Qtr3', '22_Qtr4', '23_Qtr1', '23_Qtr2', '23_tr3', '23_Qtr4'],
     datasets: [{
       label: 'Some random quartley demo data..',
       backgroundColor: 'black',
       borderColor: 'lime',
       data: [40.2, 72.88, 47.1, 22, 54.43, 52.18, 17.1, 52, 67.2, 54.88, 64.1, 78, 67.2, 55.88, 58.1, 57, 50.2, 52.88, 57.1, 62, 74.43, 62.18, 67.1, 72, 77.2, 74.88, 74.1, 78, 77.2, 75.88, 78.1, 77, 70.2, 72.88, 77.1, 62, 64.43, 62.18, 67.1, 72, 67.2, 54.88, 44.1, 28, 27.2, 25.88, 38.1, 37, 40.2, 42.88, 44.1, 52, 54.43, 52.18, 67.1, 82, 87.2, 84.88, 84.1, 88, 87.2, 95.88, 108.1, 127]
     }]
   },
    "options": {
       "legend": {"position": "bottom"}
     }
 });
 </script>
 </body>
 </html>
Reference: https://www.chartjs.org/