To keep it short and sweet let's go with the definition:
"A small multiple (sometimes called trellis chart, lattice chart, grid chart, or panel chart) is a series of similar graphs or charts using the same scale and axes,allowing them to be easily compared. It uses multiple views to show different partitions of a dataset."
Read any serious visual communication guide and it will invariably highlight this powerful tool we have at our disposal when we have the data (we almost always have the data).
A pair of Small Multiples example quite pertinent to the current times followed by some other good ones:
This CNN.com graphic captures a running snapshot of the "new case/spread" curve trajectory of individual states
This clearly communicates how each state unemployment picture fared from 1976-2009
This SM visual shows population change over time by country (look at Mexico's growth since 1960)
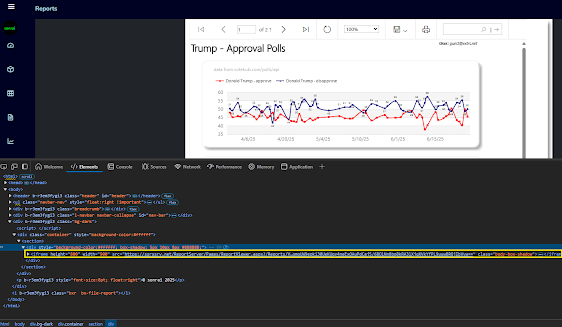
Here is a response from the SSSR REST API in action.. (you can access a lot more SSRS item properties and customize at will once you know the API)
The SSRS API v2 has far more functionality than v1, but they essentially work the same. You must be authenticated to the SSRS report server you are targeting (localhost in this case) to make web GET/POST requests to the API.
Once auth'd you can push and pull any useful SSRS data pretty easily to make SSRS do some pretty cool things it can't do out of the box..
This is the SSRS API as accessed through a web browser; simply give your .NET app an HttpClient and you can make use of all these responses; it's just JSON...
You can get a collection of SSRS catalog items as in the example above (folders, reports, KPIs) by just specifying the action name, or you can select an individual item by putting the item GUID in parenthesis in the API request URL:
You can access individual items in the API via GUID in parens after the API action name.
Common Useful SSRS API v2 Actions:
Reports
Datasets
Data Sources
Folders
Schedules
Subscriptions
Comments
KPIs
CatalogItems (everything)
Example of a .NET Standard library with an HttpService abstacting the SSRS API calls:
namespace ExtRS
{
public class SSRSHttpService
{
const string ssrsApiURI = "https://localhost/reports/api/v2.0";
HttpClient client = new HttpClient(new HttpClientHandler() { UseDefaultCredentials = true });
public async Task<GenericItem> GetReportAsync(Guid id)
{
client.BaseAddress = new Uri(ssrsApiURI + string.Format("/reports({0})", id));
var response = await client.GetAsync(client.BaseAddress);
var odata = response.Content.ReadAsStringAsync().Result;
return JsonConvert.DeserializeObject<GenericItem>(odata);
}
}
}
This is verbose to better break down the steps of what is happening on the ExtRS service end
A very basic class designed to demonstrate using SSRS API Response to create a .NET object:
using Newtonsoft.Json;
using System.Collections.Generic;
namespace ExtRS
{
public class GenericItem
{
[JsonProperty("@odata.context")]
public string ODataContext { get; set; }
[JsonProperty("Id")]
public string Id { get; set; }
[JsonProperty("Name")]
public string Name { get; set; }
[JsonProperty("Path")]
public string Path { get; set; }
}
}
The power of the SSRS API is limited primarily your imagination- lots of customization can be made
And finally, called from a Controller Action in an MVC app:
using System;
using System.Web.Mvc;
using System.Threading.Tasks;
using ExtRS;
namespace Daylite.Controllers
{
public class ReportsController : Controller
{
public SSRSHttpService service = new SSRSHttpService();
public async Task<ViewResult> GetReportsAsync()
{
return View("Index", await service.GetReportsAsync());
}
public async Task<ViewResult> GetFoldersAsync()
{
APIGenericItemsResponse result = await service.GetFoldersAsync();
return View("Index", result);
}
public async Task<ViewResult> GetReportAsync(Guid id)
{
GenericItem result = await service.GetReportAsync(id);
return View("Index", result);
}
}
}
"The representation of numbers, as physically measured on the surface of the graphic itself, should be directly proportional to the quantities represented." -Edward Tufte
It is amazing how easy it is to find highly inaccurate and misleading data graphics and charts even in this year 2019. These inaccuracies and sometimes outright perversions of the truth are of particular concern to an insta-culture who gets its news in headlines, memes, charts and other bite-sized generalizations via social media and rarely looks for the evidence beyond the headlines and the source data behind the charts.
The “Lie Factor”, first defined by American statistician Edward Tufte is defined as "a value to describe the relation between the size of effect shown in a graphic and the size of effect shown in the data." A larger Lie Factor value indicates a higher level of deception or "inaccurate scaling/weighting".
Lie Factor in Action:
The numbers do not equate to the scale of the bars and money bags... not quite as "strong" as projected.
This example mixes 2 different scales and data sets and only serves to confuse the reader...
This is a propaganda data graphic displaying a series of 5 increases using a totally nonsensical scale
This graphic shows Last Year, Last Week, and Current Week as having the same temporal scale.... O'Lie Factor.
Lie Factor Breakdown:
Lie Factor is the change shown in the graphic (say 100%) divided by the change reported in the data (say "50%") - (100/50 = a LF of 2)
There are reasons for misleading graphics that go beyond propaganda and sensationalist news articles:
Lack of quantitative skills on the part of the graphic creator and publication editor
Doctrine that statistics are boring and therefor need to be "jazzed up"
Doctrine that graphics are only for unsophisticated and so don't need "accuracy constraints"
Failure to treat graphics with the same fidelity to the truth as the written word it accompanies
Other ways that graphical information displays are corrupted include cherry-picking data, making small changes appear large by showing a small scale interval and when all else fails for information manipulators- using fake data.
It is important to not jump to conclusions when assessing graphical information displays even if it is coming from a reputable publisher. As you can see it is not always obvious that the information being communicated graphically is accurate. Wherever possible, get a look at the source data.
"When we see a chart or diagram, we generally interpret its appearance as a sincere desire on the part of the author to inform. In the face of this sincerity, the misuse of graphical material is a perversion of communication, equivalent to putting up a detour sign that leads to an abyss" - Wainer
ETL is the process by which you can take (Extract) data from various (usually related) data sources, Transform that data to meet your destination system's needs, and finally Load that transformed data into the destination system data store.
Your table structure will be something along the lines of this basic template:
In a real-world db environment Staging, OLAP, OLTP and other data repos may be on different database servers, this is same db server for demonstration
We will use SQL Server Integration Services (SSIS) and develop the SSIS package within the Visual Studio 2017 IDE.
The first step of the SSIS package load (INSERT) the data into a STAGING area database. This allows us to:
Store off the intermediate data from all sources into analysis-friendly OLAP datastores
Perform data integrity checks
Keep extraction and transformation as two strictly separated steps
We load the data from the various source files (.csv, .xls, .xlsx) into SQL Server database Staging table(s) using SSIS Source and Destination Data Flow Tasks connected with the movable data flow arrows. Once you have connected a source and destination you can go into the Destination Data Flow Task and edit the mappings of which source columns should be written to which destination columns.
Next we perform some transformations. This can be anything from a simple ranking or status/flagging/business prioritization algorithm to data cleansing to data partitioning based on certain criteria; the key is that this Transform step is where we apply T-SQL UPDATEs to transform the data once it has all been aggregated in Staging.
Then we refresh the OLAP destination tables using the same kind of Source and Destination Data Flow Tasks and mappings as used for Staging. The OLAP data is used for data analysis.
Finally, we load the cleansed Staging data into our destination system's OLTP database and email or text message the system owner upon successful completion of the SSIS ETL job (or deliver an error if anything fails). The OLTP data stores live transactions.
Bear in mind that most ETL data-flow step mappings are not a 1:1 match; this is just an e2e demo of SSIS ETL in most basic form
Happy ETL'ing, and be sure to watch out for cases of mysterious symbols/characters from miscellaneous data copied from other programs or from other system environments that were using a Language setting (codepage) which is incompatible with your ETL software. Bad data happens more than you think and as we say, GIGO.
Your end result looks like this (all Green Checkmarks indicates all was successful; I recommend using PaperCut for SMTP testing- super cool and useful product
I would attach or GitHub the source code (and will do so upon request) but SSIS project code has a lot of dependencies and can get quite messy for another to re-use project on even just a 'slightly different' machine.
Having used SSIS' now-deprecated predecessor "DTS" (SQL Server Data Transformation Services) and SSIS for many years I can attest to the fact that the best way to learn this product is by diving right in on your own and begin the creation of sources and destinations and source/destination connection managers and control flow events, and .NET integration, and exception event handlers, etc.
You will likely run into some ambiguous and not well-documented errors when developing in SSIS; but persist in your efforts and you can create a very powerful EDI system with the many capabilities of SSIS and the robust Scheduled ETL jobs that it can create.
First it is helpful to understand the basic premise behind Graph Theory, which is the foundation of these "Pairwise relations between objects" that we can store and explore in graph databases. The mathematical representation is the formula:
A graph (G) is equal to the connections of its entity nodes aka "vertices" (V) with its relationship edges (E)
Swiss mathematician Leonhard Eueler was looking for a solution to a puzzle on the relationships between land masses and bridges in the Prussian city of Konigsberg. This was the genesis of Graph Theory:
"The geometry of position, now known as Graph theory"
Graph database technology is useful for analyzing complex relationships and relationship behaviors in myriad scenarios not limited to:
Computer Networking
Spread of Gossip
Fraud Detection
Forensic Investigations
Flight Mapping/GPS
Population Growth
Spread of Infectious Disease
Hierarchy Visualization
It is also vital component for the analysis of (increasingly) unstructured data. By unstructured we typically mean data that is not easily modeled in a traditional relational hierarchy but may still have common properties and so still have relationship value. It is estimated that around 80-90% of an organization's data is unstructured.
Example of a couple simple graph relationships
Relationships in graph data are formed by the edge tables which signify a relationship between two different entities or "nodes" which are stored in node tables. Instead of RDBMS FK/PK and other check constraints, the relationships are defined in the edge tables; all of the properties that one would want to query via CQL to find things are stored in JSON metadata inside the node tables instead of the columns-for-each-property that defines relational data architecture.
Node Tables:Represent a data entity
Edge Tables:Store relationships between nodes
For the RDBMS purists and skeptics out there, I recommend this quote about Node, Graph and other alternative data processing paradigms vs. the traditional RDBMS OLTP and OLAP models:
"The NOSQL acronym is: Not Only S Q L. NOSQL solutions are not a replacement or successor for RDMBS systems, nor were they ever intended to be. They are useful tools to be used for specific purposes. They are to be used as part of an organisation’s data management solution and not as a total replacement for the existing solution".-Simon Munro
It is important to note that graph data can be queried in much the same way as SQL through a graph-specific query language called CQL (cipher query language) as you will see in the following demonstration.
For a quick demonstration on how easy it is to get up and running with this technology we will be using Neo4j which you can download here: https://neo4j.com/download/
Walkthrough of Neo4j:
Fire up the Neo4j Desktop client, click "New" and then click the "Add Graph" button to create your first graph database. Once the db has been created, click the play icon to start it up (it must be running for Neo4j browser to connect).
This is the Neo4j main home screen from which you can create and connect to graph databases and projects
Then click the "Neo4j Browser" button to launch the graph data browser for creation and visual exploration of graph data relationships.
Next, in the Neo4j browser, click "Jump into Code" and simply follow the prompts to begin creation and querying of graph data.
Once, in the Neo4j tutorial, you can simply follow the prompted instruction widgets.
I would continue with instructions but the rest is refreshingly self-explanatory. You first create a movie database that contains actors, directors and movies stored in Node (entity) tables and the types of relationships between these Nodes stored in Edge (relationship type) tables.
One thing to note is that to execute a CQL command in the browser, you must hold down CTRL+Enter. Alternatively you can click the play button to execute CQL.
As you continue with the tutorial you will wind up with something like this when you get to the step that has you execute CQL to find all Node entities that are within 4 degrees (or node "hops") of the actor Kevin Bacon:
4 degrees of separation from Kevin Bacon...
Once you get comfortable with CQL syntax it is relatively easy to start modeling and creating your own graph database structures which can help you and/or your company to analyze some of the unstructured and semi-structured data that is hard to extract value from with traditional RDBMS.
Bigtime kudos to the Neo4j team on making this so straightforward and simple to learn and get up
and running with a new technology so fast. I've never seen a technology tutorial like it.
As you can see, there is tremendous potential value in exploring data relationships that don't necessarily fit neatly into traditional RDBMS/hierarchical databases but are no less useful a tool to have in an organization's data analysis arsenal.
OLAP can adequately be described as the storage of redundant copies of transactional records from OLTP and other database sources. This redundancy facilitates quick lookups for complex data analysis because data can be found via more and quicker (SQL execution) paths than normalized OLTP. And OLTP after all- should stick to its namesake and what it does best: processing, auditing, and backing up online transactions, no? Leave data analysis to separate OLAP Warehouses.
OLAP data is typically stored in large blocks of redundant data (the data is organized in ways to optimize and accelerate your data mining computations). Measures are derived from the records in the fact table and dimensions are derived from the dimension tables.
Facts are "measurements, metrics or facts of a particular process" -Wikipedia. Facts are the measurement of the record value: "$34.42 for today's closing stock price", "5,976 oranges sold at the market", "package delivered at 4.57pm", etc.
Dimensionsare "lists of related names–known as Members–all of which belong to a similar category in the user’s perception of a data". For example, months and quarters; cities, regions, countries, product line, domain business process metrics, etc.
Dimensions give you a set of things that you can measure and visualize in order to get a better pulse and better overall understanding of the current, past and even potential future (via regression models) shape of your data- which can often alert you to things you might not be able to see (certainly not as quickly or easily) in an OLTP-based Data Analysis model which is often tied to production tables out of necessity or "we don't have time or money to implement a Data Warehouse".
Yes, you definitely do need OLAP/DW capabilities if you think long-term about it. Having intimate knowledge of your operations and how you can change variables to better run your business? Why would any business person (excepting those committing fraud) not want that?
I'd say that implementing a true and effective OLAP environment is worth any project investment and would pay itself over and again in the way of better and more specific/actionable metrics that help administrators of operations make the best, data-backed decisions- some very critical decisions involving millions of dollars and sometimes lives. I'd like a better look at the data before making a multi-million dollar or life/death decision.
SAS, Hadoop, SSAS, with healthy doses of R and/or Python customization?- whatever data solution you choose, my advice is to go with something that has a great track record of providing the kind of solutions that your business and/or your industry require. Use the tool that your ETL developers can utilize effectively and that helps you to best meet the needs of your constituents with whom you will exchange data with (the company, the customer, industry and/or regional regulation compliance).