Showing posts with label Report Server. Show all posts

The slow death of SSRS and future of "PBIRS"

Microsoft has announced the inevitable- SSRS is not long for the world.


SSRS is now PBIRS and sadly, after 2033, PBIRS is likely going away in favor of costly, subscription-based MSFT reporting


There will apparently be no new features for RDL-based paginated reports moving forward unless MSFT changes course. All MSFT investments in data visualization and business intelligence are going to Power BI and other "Power Automate" tools.


For over 20 years, SSRS and RDL-based paginated reports have served a vital role supporting business intelligence and data visualization


This is not entirely a bad thing but I do have some thoughts on the sad reality that is the current state of Power BI, namely- its massive feature and extensibility limitations with respect to its predecessor, SSRS.

The first big one is report access. SSRS reports were available to anyone in the enterprise. And with custom authentication like extRSAuth, reports could be made available to any logged-in SaaS customer or otherwise authenticated client- for free. Most everything in Power BI requires a monthly subscription.


Note that the "Free" pricing tier has significant limitations (not very useful to develop reports in isolation...)


The second big one is scheduled reports and report archiving for auditing and comparison purposes via report snapshot functionality. Scheduled reports and snapshots are made possible via the PBI Report Server on-prem engine, but as the PBIRS on-prem engine is only supported through January of 2033 the question for organizations considering continuing with RDL-based schedulable and snapshottable reports is- "will we be cut off (unsupported) after January 2033?".

Sadly, everything is moving to a subscription-based model and this has everything to do with short-term "value demonstration" and the prioritization of short-term profits over long-term product excellence and long-term customer satisfaction. (more on this in a future post...).


Not an ideal way to present an external customer-facing report...

If I had to make a bet on the future, based on MSFT's current avaricious and short-sighted, "Subscription-and-AI-everything-customer-opinion-and-developer's-be-damned*" business direction- SSRS and its successor PBIRS will be completely phased out after 2033 and the only option will be Power BI reports, with Power BI offering some expensive, newfangled version of schedulable .pbix reports. Probably called something ridiculous like "Fabric Delivery Service". I doubt they will continue to support snapshot auditing capabilities, but they should.

Lastly, a sad consequence of the universal move away from code sharing, "actually free/unlimited use" software and software extensibility in general, is that Power BI binary files (.pbix) cannot be utilized outside of being decompiled by a Power BI editor. In the heydays of SSRS, you could view any .rdl, .rsd or .rds file and immediately inspect a report, dataset or data source (XML) file and make edits on the fly through a text editor or an API. This is no longer possible.

There have been innumerable SSRS scripts implemented at organizations to update large batches of data sources, datasets and reports to point to new data sources, data fields or to make mass updates to column text, report labeling or table definitions. So the removal of this functionality is kind of a big (raw) deal.


Paginated RS Reports (.rdl)  

RDL report files are XML-based and report definitions are clearly defined in the files; fortunately PBIRS is supporting paginated reports and the PBI Report Server database and engine for several more years.


Interactive PBI Visualizations (.pbix)


PBI report files are illegible compiled binary code; report definitions can only be decompiled, viewed and modified through tools like the online Power BI editor or downloadable Power BI Desktop programs. PBI interactive reports are the MSFT-recommended approach for all data reporting (except apparently, their own as is demonstrated below in the example of a SSMS 21/SQL Server 2025 standard, RDL-based database report).


There is a long way to go before SSRS reports disappear from the MSBI landscape completely however; SSRS will continue to be supported until January 11, 2033 according to Microsoft's recently posted Reporting Services consolidation FAQ.

In fact, if you look at Microsoft products like SSMS 21, you'll see regular old SSRS/RDL reports being rendered through the Report Viewer control when running reports for SSIS execution history, Job execution history, Database Standard Reports and many other SSMS reports.


Right-click any SQL Server database and you can view a suite of useful (if outdated looking) Standard Reports 


Ngl these reports look very 2008ish (3D is not recommended for serious dataviz)- but they are indeed SSRS/RDL


Comparing search terms via Google Trends it is clear that the push to Power BI accelerated in 2017 and has ramped up to the point where general interest in SSRS is negligent compared to interest in Power BI, despite SSRS offering robust, extensible on-prem report solutions for free and Power BI be buggy, considerably "locked down" and charging a relatively expensive monthly per-user subscription.


Google search interest in Power BI eclipsed SSRS in 2017 and has only risen since


But this is merely how marketing-sales-product singularity and product obsolescence works. If Galactus (MSFT) deems it so, it'll be so.


😕

😞


*we have come a long, long way from then-Microsoft CEO Steve Ballmer's infamous but earnest, "Developers!!, Developers!!, Developers!!" rant at a Windows conference in 2006. 😐


References:

https://www.mssqltips.com/sqlservertip/6867/ssrs-vs-power-bi

https://learn.microsoft.com/en-us/sql/reporting-services/reporting-services-consolidation-faq?view=sql-server-ver16


Embedding RS reports, HighCharts, and PBI interactives in ASP.NET Core MVC views


SSRS embed
 @model ReportView  
 <script>  
 </script>  
 <div class="container" style="background-color:#ffffff">  
   <section>  
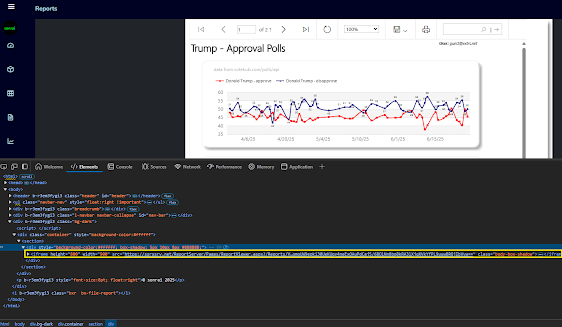
     <div style="background-color:#ffffff; box-shadow: 5px 10px 8px #888888;">  
       <iframe height="800" width="900" src="@Model.SelectedReport.Uri" class="body-box-shadow"></iframe>  
     </div>  
   </section>  
 </div>  
This is the entire view of _Report.cshtml which renders the RS report; see the extRSAuth project for how to enable non-Windows AD SSRS client authentication


The <iframe> is rendered with the URL of the report on your report server which renders a ReportViewer control view of the report


HighCharts embed
 <script src="https://code.highcharts.com/highcharts.js"></script>  
 <script src="https://code.highcharts.com/themes/adaptive.js"></script>  
 <head>  
   <script>  
     $(document).ready(function () {  
       Highcharts.seriesTypes.line.prototype.getPointSpline = Highcharts.seriesTypes.spline.prototype.getPointSpline;  
       Highcharts.chart('potusApproval', {  
       title: {  
         text: 'Trump Job Approval',  
         align: 'left'  
       },  
       subtitle: {  
           text: 'Source: <a href="https://api.votehub.com/polls?poll_type=approval&subject=Trump" target="_blank">VoteHub</a>.',  
         align: 'left'  
       },  
       yAxis: {  
         title: {  
           text: 'Approval'  
         }  
       },  
       legend: {  
         layout: 'vertical',  
         align: 'right',  
         verticalAlign: 'middle'  
       },  
       plotOptions: {  
             area: {  
               pointStart: '1/1/2025',  
               relativeXValue: false,  
               marker: {  
                 enabled: true,  
                 symbol: 'circle',  
                 radius: 2,  
                 states: {  
                   hover: {  
                     enabled: true  
                   }  
                 }  
               }  
             }  
           },  
       series: [{  
         name: 'Approve',  
         data: [ @string.Join(", ", Model.HighChartsModel.Approves) ]  
       }, {  
         name: 'Disapprove',  
         data: [ @string.Join(", ", Model.HighChartsModel.Disapproves) ]  
       }],  
     });  
   });  
   </script>  
 </head>  
 <table style="width: 100%; height:50%">  
   <tr><td><div id="potusApproval"></div></td></tr>  
 </table>  
The same data can easily be embedded as a HighCharts visual using some JS and HTML; this example uses the simple HighCharts LineChart


The above HighCharts embed code renders this line chart


Power BI embed


The easiest Power BI embedded method is to use the Developer Playground "demo code" script; select File >> Developer Playground


Next, click the "Set up now" button on the upper right side of the following screen


Here you are presented with the embed <iframe> script that you put into your view... 


 <iframe title="PBI_Report" style="width:100%; height:73%" src="https://app.powerbi.com/reportEmbed?reportId=695fe0f1-5c9e-497d-8913-e59f0b939ac4&autoAuth=true&embeddedDemo=true" frameborder="0" allowFullScreen="true"></iframe>  


And, voila! You have a Power BI visual embedded inside your web app now


Reference: https://learn.microsoft.com/en-us/power-bi/developer/

Source: https://github.com/sonrai-LLC/extRS/tree/main/ExtRS.Portal | https://extrs.net


SSRS Extension Methods - The 3 Levels

When developing SSRS reports, if you are unable to achieve what you want through SQL and RDL alone, there are essentially 3 ways you can add custom functions/functionality to SSRS.

1). Inline SSRS "Expressions". (VBScript code)

2). Report.Code references (VB code)


3). Custom Assembly references (C# or VB .NET .dll)


The following is a brief example of each.

1). Inline SSRS Expressions
In SSRS, virtually every report property can be dynamic. The way to set the dynamic behavior of any report item is through SSRS Expressions which are simply VBScript code blocks that evaluate some logic against the report data and return the property value at runtime.

For instance, here we are setting the Font >> FontWeight property of the Order Date column for an Orders report (AdventureWorks sample data). If the Date is more than 1 year in the past, this inline expression sets the FontWeight of the OrderDate field to bold:

Method 1 Code

Method 1 Result

You can use IIF(), Choose(), Switch() or any valid VBScript syntax. The report field values are referenced as Fields!OrderDate.Value. As in the example above, you will oftentimes need to cast the report dataset data to the data type which you are evaluating (a cast to CDate in this example as we are evaluating a Date).

2). Report Code references (VB code)
This method is similar to Method #1, but it allows you to define a VB Code space where you can define functions in a central place and reference them any number of times throughout your report.

For this example, let's say we need to have a report function that takes a string as a parameter and then evaluates the length of that string. If the string value is over 10 characters long, it sets the Color to Red, if not, the color is the default Black. Your Report Code methods are defined in: Report >> Report Properties >> Code:

Method 2 Code

Method 2 Reference

Method 2 Result


3). Custom Assembly references (C# or VB .NET .dll)
This is the most comprehensive of the 3 methods and allows you to do anything that you could normally do with a .NET assembly.

For illustrative purposes, let's say we have a need to interface with a backend system and get a URI which will fill a report image item with the appropriate image from an external server that is not connected to the Report Server. You can implement the necessary .NET logic and API calls, etc. in your custom assembly and then reference that .dll in your report:

 namespace SSRSCustomAssembly  
 {  
   public class ErpReferenceLib  
   {  
     public static string GetImageForCustomerAccount(int customerID)  
     {  
       //this example is static; in real-world implementation the customerID might fetch value from db or API  
       bool isActiveAndValid = CheckCustomerIDIsValidAndActive(customerID);  
       if (isActiveAndValid)  
       {  
         return "https://abccorp.imagesrv?customerID=" + customerID + ".svg";  
       }  
       else  
       {  
         return "https://abccorp.imagesrv?inactive.svg";  
       }  
     }  
     public static bool CheckCustomerIDIsValidAndActive(int customerID)  
     {  
       return customerID >= 100 ? true : false;  
     }  
   }  
 }  
Method 3 Code

Method 3 Report Reference


Method 3 Report Item Reference- NOTE: You cannot use namespaces separated with ".", ie: MyNamespace.Subnamespace


Method 3 Visual Studio Report Design View

Method 3 Result in VS2017 Preview Mode

Method 3 Result on local Report Server

For more information (esp. how to do the necessary custom assembly security permission config changes, for creating object instances vs. static methods, etc.), see the relevant references below.

Note(!): your custom assembly must have permission to run within Visual Studio in order to Preview a report that calls a custom assembly method and it must also have permission within Report Server. You can grant it FullTrust or whatever CAS group you deem is appropriate. The paths to deploy the .dll are as follows (may vary by SQL Server and Visual Studio version- this is for SQL 2017 and VS2017):

Visual Studio Report Designing/Preview assemblies*: C:\Program Files (x86)\Microsoft Visual Studio\2017\Community\Common7\IDE\CommonExtensions\Microsoft\SSRS

Report Server assemblies*: C:\Program Files\Microsoft SQL Server Reporting Services\SSRS\ReportServer\bin

GitHub for SSRS Project: https://github.com/Radagast27/CustomSSRS

GitHub for SSRS Custom Assembly: https://github.com/Radagast27/CustomAssembly


*https://www.mssqltips.com/sqlservertip/3224/sql-server-reporting-services-custom-code-assemblies/