Animated X-to-Horizontal Lines (Hamburger) Toggle for UI Menu

Here is what you are looking for: https://codepen.io/radagast27/pen/OYmvmd

Implementing this UI feature is just a matter of wiring up some icon animation and fadeIn()/fadeOut() to the menu items.

 <html>  
 <head>  
 <script  
  src="https://code.jquery.com/jquery-3.4.1.min.js" integrity="sha256-CSXorXvZcTkaix6Yvo6HppcZGetbYMGWSFlBw8HfCJo=" crossorigin="anonymous"></script>  
 <script>  
 $(document).ready(function(){  
      $('#nav-icon').click(function(){  
           $(this).toggleClass('open');  
       if($('#menu').css('opacity') == '0'){  
        $('#menu').css('opacity','1');  
        $('#menu').fadeIn(300).css('display','table');  
       }else{  
        $('#menu').css('opacity','0');  
        $('#menu').fadeOut(300).css('display','none');  
       }  
      });  
 });  
 </script>  
 </head>  
 <style>  
 body{  
  background-color: #000000;  
 }  
 #menu{  
   z-index: 5;  
   width: 40%;  
   height: 40%;  
   background-color: rgba(0,0,0, 0.95);  
   position: fixed;  
   font-family: Arial;  
   font-size: 1.5em;  
   text-align: left;  
   left: 100px;  
   top: 0px;  
   opacity: 0;  
   display: table;  
 }  
 .hidden{  
   display: none;  
   visibility: none;  
 }  
 #menu ul{  
   margin: 0;  
   padding: 0;  
   z-index: 10;  
   width: 40%;  
   height: 40%;  
   display: table-cell;  
   vertical-align: left;  
 }  
 #menu ul li{  
   cursor: pointer;  
   text-decoration: none;  
 }  
 #menu ul li:hover{  
   background-color: cyan;  
   -webkit-transition: .15s ease-in-out;  
   -moz-transition: .15s ease-in-out;  
   -o-transition: .15s ease-in-out;  
   transition: .15s ease-in-out;  
 }  
 #menu ul a{  
   letter-spacing: 5px;  
   text-align: left;  
   margin-left: 0px;  
   color: #fff;  
   list-style: none;  
   padding: 0px;  
   line-height: 75px;  
   padding: 10px 70px;  
   text-decoration: none;  
 }  
 #menu ul a:hover{  
   text-decoration: none;  
   color: #fff ;  
 }  
 #nav-icon {  
   z-index: 20;  
  width: 50px;  
  height: 35px;  
  position: relative;  
  margin: 25px;  
  -webkit-transform: rotate(0deg);  
  -moz-transform: rotate(0deg);  
  -o-transform: rotate(0deg);  
  transform: rotate(0deg);  
  -webkit-transition: .5s ease-in-out;  
  -moz-transition: .5s ease-in-out;  
  -o-transition: .5s ease-in-out;  
  transition: .5s ease-in-out;  
  cursor: pointer;  
 }  
 #nav-icon span {  
  display: block;  
  position: absolute;  
  height: 5px;  
  width: 40px;  
  background: #bada33;  
  opacity: 1;  
  -webkit-transform: rotate(0deg);  
  -moz-transform: rotate(0deg);  
  -o-transform: rotate(0deg);  
  transform: rotate(0deg);  
  -webkit-transition: .25s ease-in-out;  
  -moz-transition: .25s ease-in-out;  
  -o-transition: .25s ease-in-out;  
  transition: .25s ease-in-out;  
 }  
 /* Icon 3 */  
 #nav-icon span:nth-child(1) {  
  top: 0px;  
 }  
 #nav-icon span:nth-child(2),#nav-icon span:nth-child(3) {  
  top: 12px;  
 }  
 #nav-icon span:nth-child(4) {  
  top: 24px;  
 }  
 #nav-icon.open span:nth-child(1) {  
  top: 8px;  
  width: 0%;  
  left: 50%;  
 }  
 #nav-icon.open span:nth-child(2) {  
  -webkit-transform: rotate(45deg);  
  -moz-transform: rotate(45deg);  
  -o-transform: rotate(45deg);  
  transform: rotate(45deg);  
 }  
 #nav-icon.open span:nth-child(3) {  
  -webkit-transform: rotate(-45deg);  
  -moz-transform: rotate(-45deg);  
  -o-transform: rotate(-45deg);  
  transform: rotate(-45deg);  
 }  
 #nav-icon.open span:nth-child(4) {  
  top: 8px;  
  width: 0%;  
  left: 50%;  
 }  
 </style>  
 <body>  
 <header>  
   <div id="topbar"> <!-- top bar -->  
       <div id="nav-icon">  
        <span></span>  
        <span></span>  
        <span></span>  
        <span></span>  
       </div>  
     <div id="menu">  
       <ul>  
         <li><a href="#">Home</a></li>  
         <li><a href="#">About Us</a></li>  
         <li><a href="#">Portfolio</a></li>  
         <li><a href="#">Case Studies</a></li>  
         <li><a href="#">Careers</a></li>  
       </ul>  
     </div>  
   </div>  
 </header>  
 </html>  
 </body>  
Some minor tweaking of the flexible code referenced above can give you a modern .js transition toggle


Reference: https://jsfiddle.net/f19kz640/

WACC (Weighted Average Cost of Capital)

Weighted average cost of capital (WACC) is the average after-tax cost of a company’s various capital sources, including common stock, preferred stock, bonds, and any other long-term debt. A company has two primary sources of financing - debt and equity - and, in simple terms, WACC is the average cost of raising that capital.

In other words, it is the average rate of return (ROR) that is expected by lenders and shareholders who provide capital to a business.

WACC is calculated by multiplying the cost of each capital source (debt and equity) by its relevant weight, and then adding the products together to determine the WACC value as seen in the WACC calculation formula:


For example, a firm's financial data shows the following:

(E) Equity = $8,000
(D) Debt = $2,000
(Re) Equity profit sharing/stockholder payment rate = 12.5%
(Rd) Interest rate on the debt = 6%
(t) Tax rate = 30%

To find WACC, enter the values into the equation and solve:

WACC = [[(8000/10000)  x 0.125] + [(2000/10000) * 0.06 * (1 - 0.3)]]

WACC = [0.1 + .0084] = 0.1084 or 10.84%

And so the weighted average cost of capital for this firm is 10.84%.

Reference: https://www.investopedia.com/ask/answers/063014/what-formula-calculating-weighted-average-cost-capital-wacc.asp

Marketing Principles

Good contemporary summary of how Price Elasticty of Demand works in markets

Price Discrimination: Co's are more competitive (read: charge lower prices) in a market where demand sensitivity to price changes is higher.

"Perfect" substitutes (commodities like milk, chicken, eggs, gas) are less common as marketing differentiates all (ie. via "Oganic", "Californian", "Eco", etc.)

 Modern market segment analysis informs decisions on customer targeting and product/service/price mix.

I was an early adopter of PC technology. My parents would be considered laggards.

Note chasm. Breach past that and you have achieved popular market acceptance.

Entity Relationship (ER) Diagrams

An entity-relationship (ER) diagram is a graphical representation of entities and their relationships to each other. It is typically used in computing in regard to the organization of data within databases or information systems.

In general, the boxes represent database tables (an entity) and the ovals represent fields in that table (attributes of the entity).

 Simple ER diagram modeling students and courses they are enrolled in


 Complex ER diagram modeling an airline reservation system

Marginal Cost and Marginal Revenue

Marginal cost is the increase or decrease in total production cost if output is increased by one more unit. The formula to obtain the marginal cost is change in costs divided by change in quantity:


Marginal revenue is defined as the "increase in gross revenue by selling one additional unit of output".


If the price you charge (marginal revenue) per unit is greater than the marginal cost of producing one more unit, then you should produce that unit.


Above you can see as Avg Cost (AC2) dips, Price (P2) drops and Output (Q) goes up. As Demand (AR) stays the same, the result is a lower price and higher output


Reference: https://www.khanacademy.org/economics-finance-domain/microeconomics/firm-economic-profit/average-costs-margin-rev/v/marginal-revenue-and-marginal-cost

Securities Valuation and RFR

Securities Valuation: "The process of determining how much a security is worth. Security valuation is highly subjective, but it is easiest when one is considering the value of tangible assets, level of debt, and other quantifiable data of the company issuing a security."

RFR: "the "Risk-Free Rate" is the rate of return of a hypothetical investment with no risk of financial loss, over a given period of time. Since the risk-free rate can be obtained with no risk, any other investment having some risk will have to have a higher rate of return in order to induce any investors to hold it."

Unlike a typical bond loan that has a set period of payments, stock valuation is difficult to calculate because some of the components that are used to calculate the intrinsic value (or "net present value") are unknown.

The challenges of stock valuation, the NPV formula, and a very basic example:


The general formula for NPV (net present value based on future expected cash flows) is:


...where r is the expected rate of return, Div is the expected dividend and P is stock price.

We can find an accurate valuation if we have sufficient information to project into the future:


You can do the calculations longhand but it is much more efficient to use a calculator to do the math for you. Using a Financial Calculator, you can solve for any of the variables in the NPV equation (find the future value (FV), find the number of payment periods (N), find the expected return (INT), etc.). Here is a link to finding these values with a Texas Instruments TI-84 calculator: http://www.tvmcalcs.com/calculators/ti84/ti84_page3


SQL, XML, and XSLT with SSIS

A common need in any business is the exchange of data through various file formats. EDI (Electronic Data Interchange) is typically defined in a document that outlines the positions, symbols, and range of acceptable values for a given file standard (834, 872, etc.).

Example of an 834 EDI formatted file

In this exercise, we are going to very quickly turn a SQL dataset result into an XML file and apply an XSL transformation to it- all through SSIS. Using the techniques described below you will be able to create a process to transform data and write data files for any EDI standard with relative ease.

One can add .NET and other customizable code via SSIS "Execute Process" and "Script Task", however in this exercise we are going to stick to the core problem of fetching data from a SQL Server, transforming that data and then writing the result to an output/destination file.

The SSIS package design

To start, create an Integration Services project in Visual Studio 2017 (install SQL Server Data Tools if your machine does not have the Integration Services Visual Studio project template).

Our project will consist of a Data Flow Task to gather our data (SQL Server to a text file containing the results as XML), and an XML Task which will apply an XSL transformation (XSLT) and write the file to disk.

Data Flow Step #1 -  Source


Data Flow Step #1 - Destination

In my example here, we are using ADO.NET to connect to SQL Server for source data as XML and then writing that data to result.txt.

result.txt (formatted to more clearly see the Customer XML elements

Next, the SSIS XML Task takes result.txt and applies an XSL stylesheet transformation to it, thereby changing the data from XML to HTML with dynamically added CustomerID values (the integer after the static text, "***CUST**ID**").

The key to the particular (CustomerID) transformation we are doing here is the following code which selects each <Customer> in the XML and writes the <CustomerID> value after "CUST**ID**".

<xsl:for-each select="Root/Customer">
 <tr>
  <td>NM1*IL*1***CUST**ID**<xsl:value-of select="CustomerID"/>****MI*YYX123456789!</td>
 </tr>
</xsl:for-each>

XML Task

XSLT is the operation, result.txt is our source data, finally.htm our destination and the XSL is Direct Input shown in the highlighted text above.

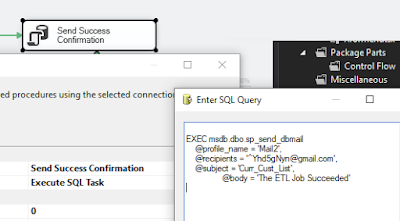
You can easily send mail on success or failure to keep the appropriate personnel informed of ETL job/service status. You can use a connected SMTP server to send mail via the SSIS Send Mail Task or (as I have in this example) you can use this T-SQL for sending mail as an Execute SQL Task:

T-SQL for sending email in Execute SQL Task

If you need to create a SQL Server Database Mail account/profile for Gmail, etc, follow this walkthrough.

And with a little luck and no missed steps, you will execute the SSIS package successfully and can go on to really leverage the powerful capabilities of SSIS to build simple and effective solutions for data interchange.

The completed SSIS package and the .htm result of our ETL exercise


Time Value of Money

"Time value of money is one of the most basic fundamentals in all of finance. The underlying principle is that a dollar in your hand today is worth more than a dollar you will receive in the future because a dollar in hand today can be invested to turn into more money in the future."


The basic formula for the time value of money is as follows:

PV = FV ÷ (1+I)^N, where:

PV is the present value
FV is the future value
I is the required return

N is the number of time periods before receiving the money

Referencehttps://www.fool.com/knowledge-center/time-value-of-money.aspx

Git Flow

Git or "directed acyclic graph" branch-based development is the maintaining of source code version history not just by file alone, but by a cryptographically unique snapshot of every file in your currently selected "working branch" at a point in time (commit).

This style of team development allows for the development of features that are isolated for easy plug-in/roll-back and integration of snapshots (commits) via merging of branches.

Developers need to beware of stepping on each other's toes (or working on the same files) as this can lead to merge conflicts.


For small business, corporate enterprise and all manner of sprawling code bases, Git is the best tool currently (March 2018) available to help manage the continuous change going on within your application source code.

Statistical Variance and Standard Deviation

Variance and standard deviation are measures of how spread out a distribution of values is. In other words, they are measures of variability within a population (all possible values) or a within a sample (a subset of the population of sufficient size to warrant statistical analysis). Standard deviation and variance, in conjunction with other statistical methods (ANOVA, F-test, T-test, etc.), are used in data analysis models to determine whether, within a sample or population, certain values or correlation between one or more values are statistically significant.


The important distinction: a standard deviation is expressed in the same units as the mean is, whereas the variance is expressed in squared units


Reference: https://stats.stackexchange.com/questions/35123/whats-the-difference-between-variance-and-standard-deviation


Functional Programming

"pass functionality as an argument to another method, such as what action should be taken when someone clicks a button. Lambda expressions enable you to do this, to treat functionality as method argument, or code as data."


Loan Amortization

What is Amortization?

Webster's dictionary defines amortization as "the systematic repayment of a debt." There are two general uses to amortization: paying off a loan over time, or spreading the cost of an expensive and long-life item over many periods.


*Depreciation: the amortization of tangible assets

Where can we find the data?

There are myriad resources to get data from a variety of domains (insurance, population, health, geography, weather, sports, etc.). You can get the data in .csv form or through API calls.

Here are a few to jump-start your data-oriented application:

Financial: https://fred.stlouisfed.org/search?st=csv

Baseball: http://www.baseball-databank.org/

Soccer: https://www.soccer24.com/team/apia-tigers/84SKUunL/

Government: https://www.data.gov/

Public: https://github.com/awesomedata/awesome-public-datasets

GIS: https://gisgeography.com/best-free-gis-data-sources-raster-vector/

Google Maps API: https://developers.google.com/maps/documentation/directions/


Reference: https://www.quora.com/What-is-the-best-financial-data-source-in-CSV-file-format